
The U.S. shopping mall industry has undergone significant transformation over the past decade, with over 300 malls closing since 2010. Yet the surviving malls — particularly Class A and B properties that have invested in entertainment, dining, and experiential retail — are generating strong foot traffic and sales. The International Council of Shopping Centers (ICSC) reports that 75% of Americans visited a mall in the past 12 months, spending an average of $100 per visit.
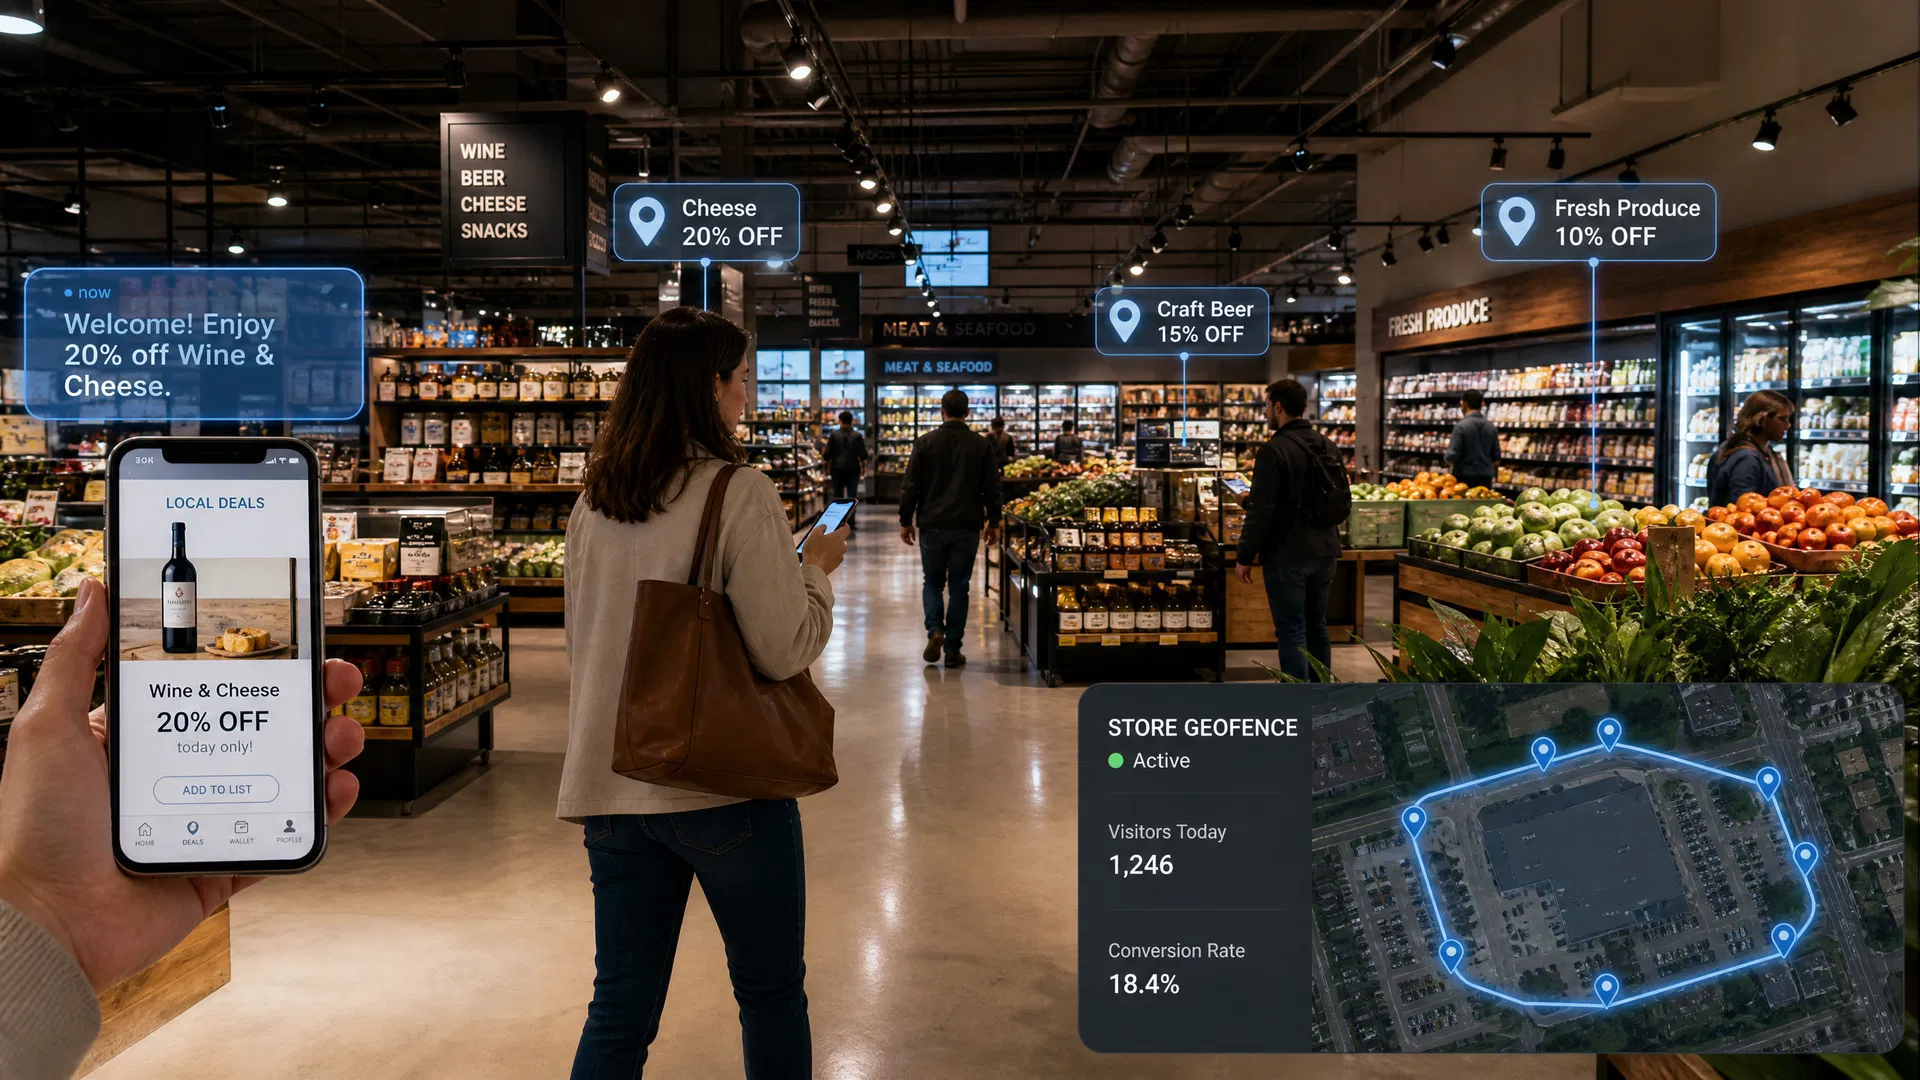
For mall marketing teams, the challenge is not just driving foot traffic — it is proving the ROI of marketing spend to anchor tenants and the property ownership group. Geofencing advertising addresses both challenges simultaneously: it drives measurable foot traffic and provides attribution data that proves which marketing activities generated which visits.
Competing Mall Conquesting
The most direct mall geofencing strategy is competing mall conquesting. By drawing geofences around competing shopping centers — including outdoor lifestyle centers, power centers, and downtown retail districts — a mall can serve targeted ads to shoppers who visit those locations and highlight the unique advantages of your property: anchor tenants, dining options, entertainment, or a current event.
For malls with strong entertainment components (movie theaters, bowling alleys, escape rooms, ice skating), the conquesting creative should emphasize the experiential advantages that competing centers cannot match. For malls with premium anchor tenants, the creative should highlight the specific brands that draw shoppers from the trade area.
Event-Based Traffic Generation
Mall events — holiday activations, fashion shows, pop-up shops, food festivals, and entertainment events — are the highest-traffic opportunities in the mall marketing calendar. Geofencing campaigns that target the trade area in the 2–3 weeks before a major event, combined with retargeting of past mall visitors, consistently produce 30–50% higher event attendance than email marketing alone.
| Mall Geofencing Strategy | Target | Goal | Expected Lift |
|---|---|---|---|
| Competing mall conquesting | Competing shopping centers | Trade area share | 15–25% |
| Event-based campaigns | Trade area households | Event attendance | 30–50% |
| Restaurant/entertainment targeting | Competing dining/entertainment | Dwell time increase | 18–28% |
| Lapsed visitor re-engagement | Devices not seen in 90+ days | Win-back visits | 12–20% |
For a free shopping mall geofencing proposal, contact Mediavision2020 today.