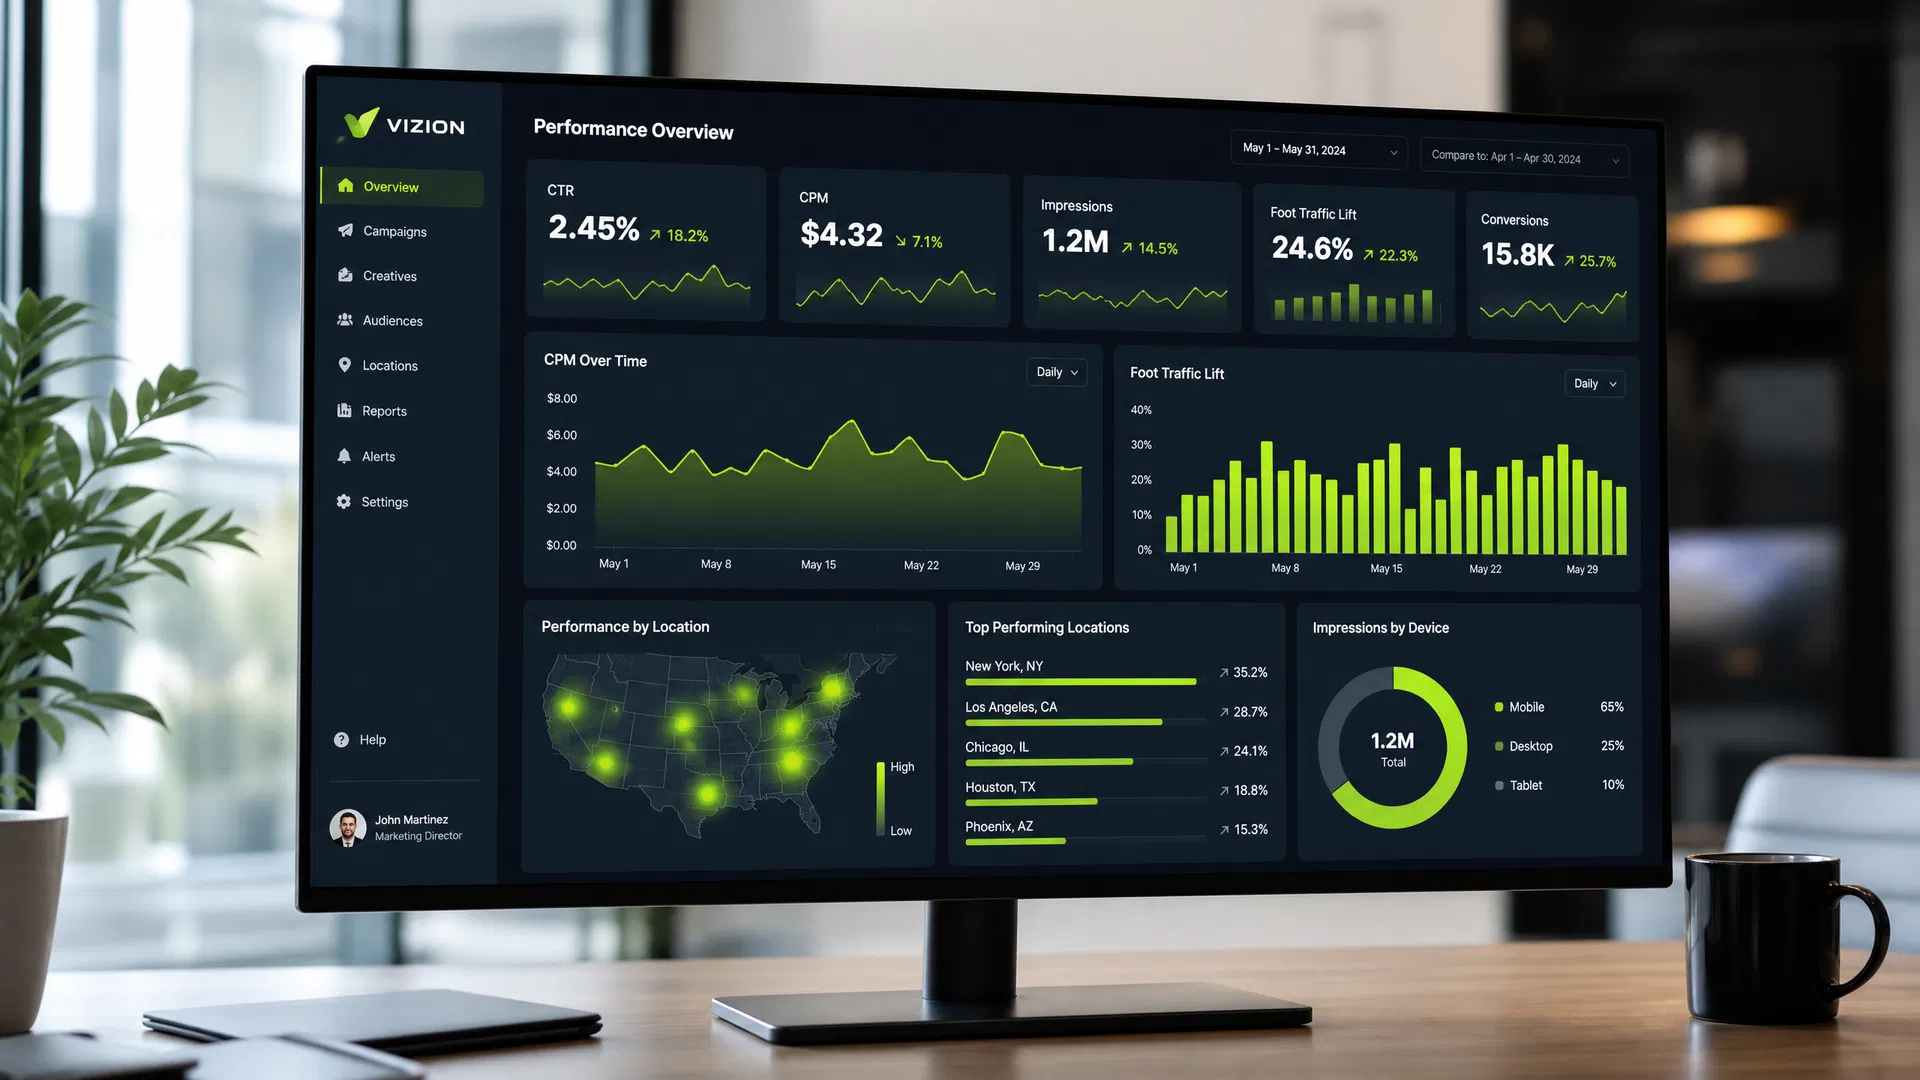

One of the most common questions we hear from new clients is: "How do I know if my geofencing campaign is performing well?" The honest answer is that performance varies significantly by industry, campaign objective, and creative quality — but benchmarks give you a starting point for evaluating results and setting realistic expectations.
Below are performance ranges drawn from geofencing campaigns across eight key verticals. Use these as directional guides, not guarantees.
Click-Through Rate (CTR) Benchmarks
Geofencing display campaigns consistently outperform standard display benchmarks (0.05–0.10%) because the audience has been pre-qualified by physical location. Across all industries, a healthy geofencing CTR falls between 0.10% and 0.35%. Here's how that breaks down by vertical:
- Automotive dealerships: 0.18%–0.32% — competitor conquesting campaigns drive the highest CTRs in this category
- Healthcare & medical aesthetics: 0.12%–0.28% — procedure-specific creative (e.g., Botox, dental implants) significantly outperforms generic clinic ads
- Restaurants & QSR: 0.20%–0.35% — dayparted campaigns (lunch and dinner windows) consistently hit the top of this range
- Retail & e-commerce: 0.10%–0.22% — promotional creative tied to a specific offer outperforms brand awareness creative by 2–3x
- Real estate: 0.08%–0.18% — open house targeting and new development campaigns perform best
- Legal services: 0.10%–0.20% — courthouse and hospital geofencing produces the most qualified clicks
- Home services: 0.12%–0.25% — neighborhood-level fencing around recent permit activity drives strong engagement
- Recruiting: 0.15%–0.30% — campus and competitor office fencing consistently outperforms job board benchmarks
CPM Benchmarks
Geofencing CPMs are higher than standard display because of the precision targeting and premium inventory required. Expect to pay between $5 and $15 CPM for most campaigns, with variation driven by:
- Fence size and precision: Smaller, more precise fences (e.g., a single building) command higher CPMs than broad radius campaigns
- Geography: Major metro markets (New York, Los Angeles, Chicago) carry 20–40% higher CPMs than mid-size markets
- Inventory quality: Premium placements in brand-safe, high-viewability environments cost more but deliver meaningfully better results
- Campaign timing: Q4 (October–December) CPMs run 15–30% higher due to advertiser competition
foot traffic Lift & Walk-In Rate Benchmarks
Foot traffic attribution is the most meaningful KPI for brick-and-mortar campaigns. A walk-in rate of 5%–15% (the percentage of served users who subsequently visited the location) is considered strong performance. Industry-specific ranges:
- Auto dealerships: 8%–18% walk-in rate — among the highest of any vertical, driven by high purchase intent
- Restaurants: 10%–20% — especially strong for QSR with a promotional offer attached
- Retail: 5%–12% — varies significantly based on whether the fence targets competitors or the brand's own trade area
- Healthcare: 4%–10% — longer consideration cycles reduce walk-in rates but increase appointment value
- Home services: 3%–8% — lower walk-in rates are offset by high average ticket values ($500–$5,000+)
What Separates Top-Performing Campaigns
After analyzing hundreds of campaigns across these verticals, the factors that most consistently separate top-quartile performers from average ones are:
- Fence placement precision: Campaigns that fence competitor locations, event venues, or specific buildings consistently outperform broad radius campaigns
- Creative relevance: Ads that speak directly to why the audience was geofenced (e.g., "Saw you at [competitor]? Here's why clients switch to us") dramatically outperform generic brand ads
- Cross-device activation: Campaigns that follow the audience from mobile to desktop to CTV achieve 2–3x the frequency of mobile-only campaigns at the same budget
- Dayparting: Aligning ad delivery to when the target location is most active (lunch for restaurants, weekday mornings for dealerships) improves both CTR and walk-in rates
If your current geofencing campaigns are underperforming these benchmarks, the issue is almost always one of three things: fence placement, creative relevance, or budget concentration. Contact our team for a free campaign audit — we'll identify exactly where the gap is and how to close it.