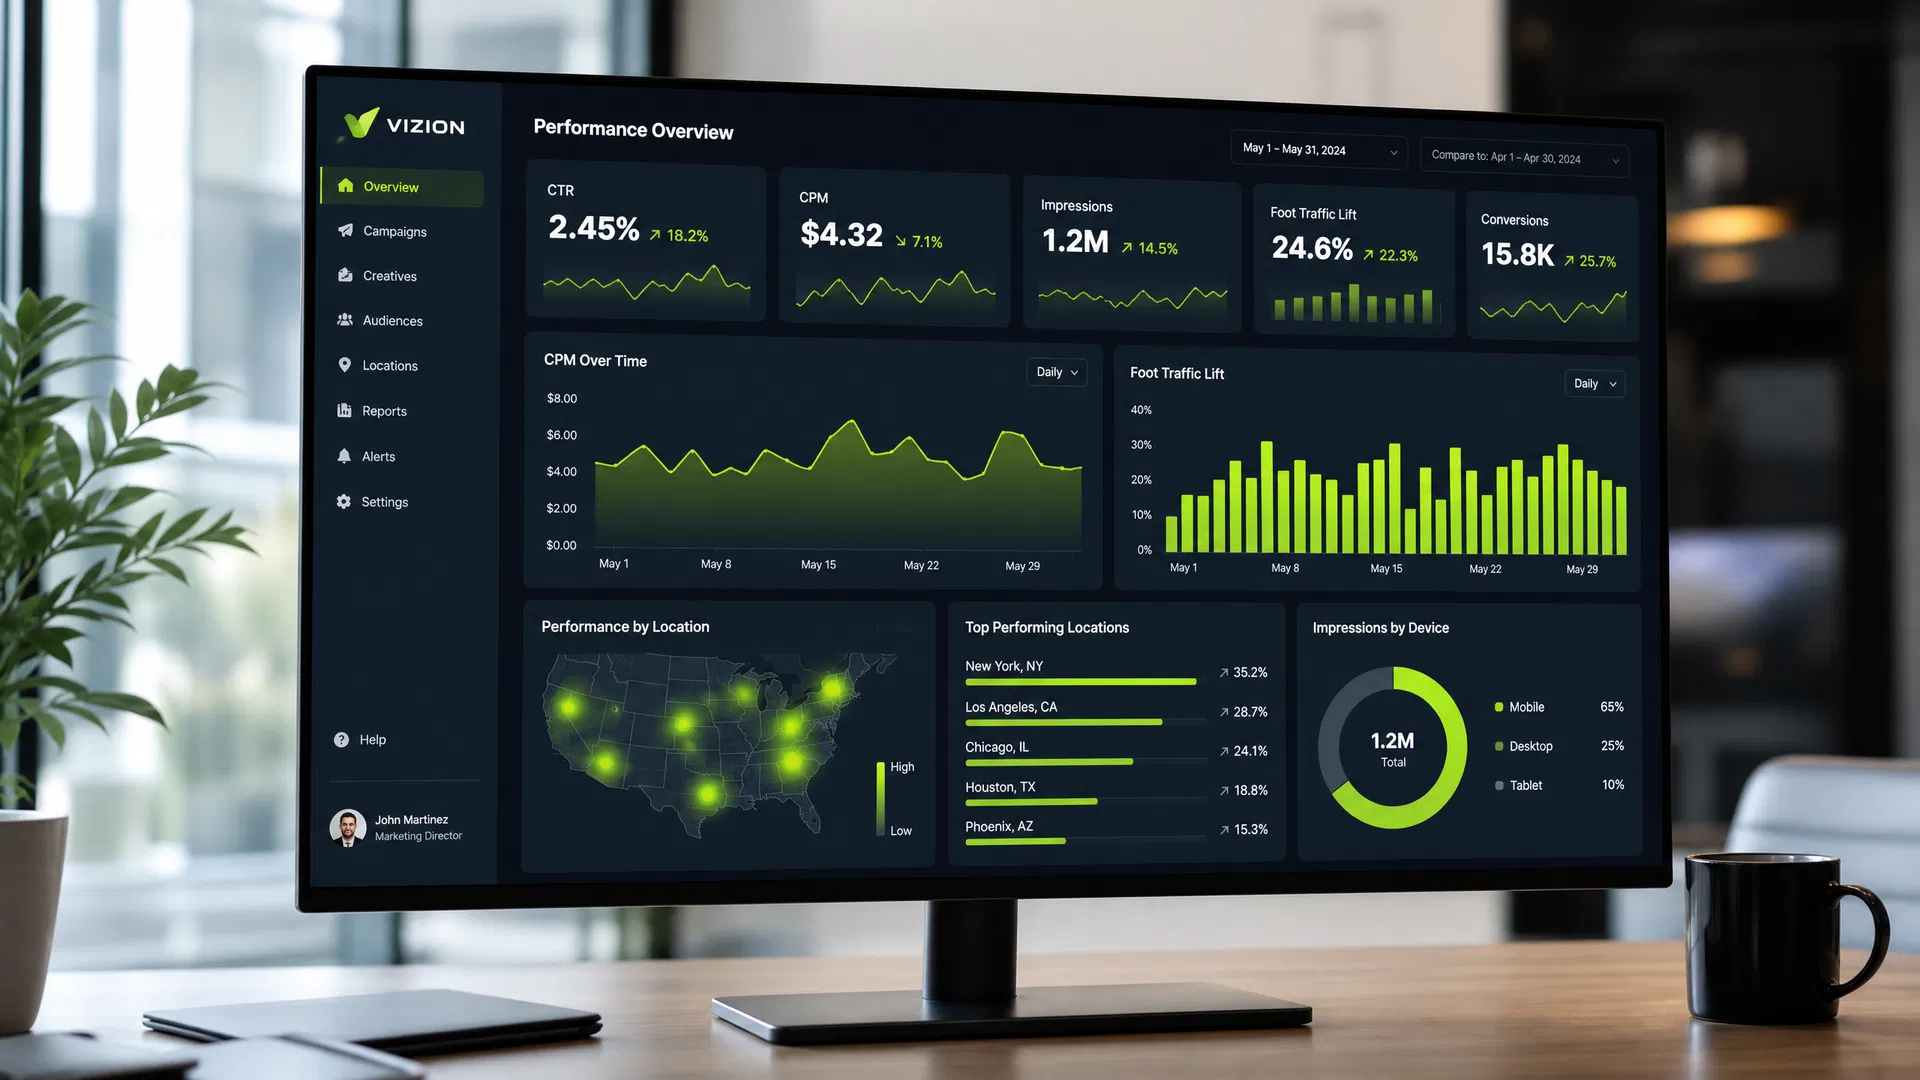

Measuring the effectiveness of your geofencing campaigns is crucial for optimizing performance and proving return on investment. While geofencing offers unparalleled precision in targeting, understanding how your audience interacts with your ads and ultimately responds to your calls to action requires a clear grasp of key performance indicators (KPIs). This post will delve into four fundamental metrics: Click-Through Rate (CTR), Viewability, Impressions, and Walk-In Rate, explaining what they are, how they are measured, and their implications for your geofencing strategy.
Click-Through Rate (CTR)
Click-Through Rate (CTR) is a fundamental metric that measures the percentage of people who click on an advertisement after seeing it. In the context of geofencing, it specifically tracks how many users, exposed to your ad within a defined geofenced area, choose to click on that ad.
- How it's Measured: CTR is calculated by dividing the number of clicks an ad receives by the number of times the ad is shown (impressions), then multiplying by 100 to get a percentage. For example, if an ad receives 100 clicks from 10,000 impressions, its CTR is 1%.
- Real-World Example: A coffee shop runs a geofencing campaign around its competitor's location. Users within that geofence see an ad for a discount on their first coffee. A high CTR would indicate that the ad creative and offer are compelling enough to entice potential customers to learn more.
- Campaign Implications: A strong CTR suggests that your ad creative, messaging, and call to action are highly relevant and engaging to your targeted audience. A low CTR might signal that your ad copy isn't resonating, the offer isn't attractive, or the targeting needs refinement. It's a direct indicator of initial ad engagement.
Viewability
Viewability is a metric that determines whether an ad had the opportunity to be seen by a user. Not all ads served are actually seen; they might be below the fold, in a background tab, or load too slowly. For display ads, the Media Rating Council (MRC) and Interactive Advertising Bureau (IAB) define a viewable impression as at least 50% of the ad's pixels being on screen for a minimum of one continuous second.
- How it's Measured: Viewability is typically tracked by ad servers and third-party verification vendors. They use various techniques to confirm that an ad meets the industry standard for being "in view."
- Real-World Example: An automotive dealership targets potential car buyers within a 5-mile radius of its showroom. They run banner ads on various mobile apps and websites. Ensuring high viewability means their budget is spent on ads that actually appear on users' screens, rather than being wasted on unseen placements.
- Campaign Implications: High viewability ensures that your advertising budget is being spent effectively on ads that have a genuine chance to make an impact. Low viewability means your message isn't reaching its intended audience, regardless of how good your targeting or creative might be. It's a quality control metric for ad delivery.
Impressions
An Impression occurs each time an advertisement is displayed to a user. It signifies that an ad has been loaded and delivered to a user's device, regardless of whether the user actually saw or interacted with it. In geofencing, impressions represent the total number of times your ad was served to devices within your defined geographic boundaries.
- How it's Measured: Impressions are counted by ad servers each time an ad creative is loaded and requested by a user's browser or app.
- Real-World Example: A new restaurant uses geofencing to target office workers in nearby business parks during lunchtime. They aim to generate a large volume of impressions to build brand awareness and drive foot traffic. A high number of impressions indicates broad reach within their target geofenced areas.
- Campaign Implications: Impressions are crucial for brand awareness and reach. A high volume of impressions within your geofenced areas means your message is being delivered to a significant portion of your target audience. While impressions alone don't guarantee engagement, they are a prerequisite for clicks, views, and conversions. They tell you if your ad delivery system is working and if your targeting is broad enough to reach your desired scale.
Walk-In Rate
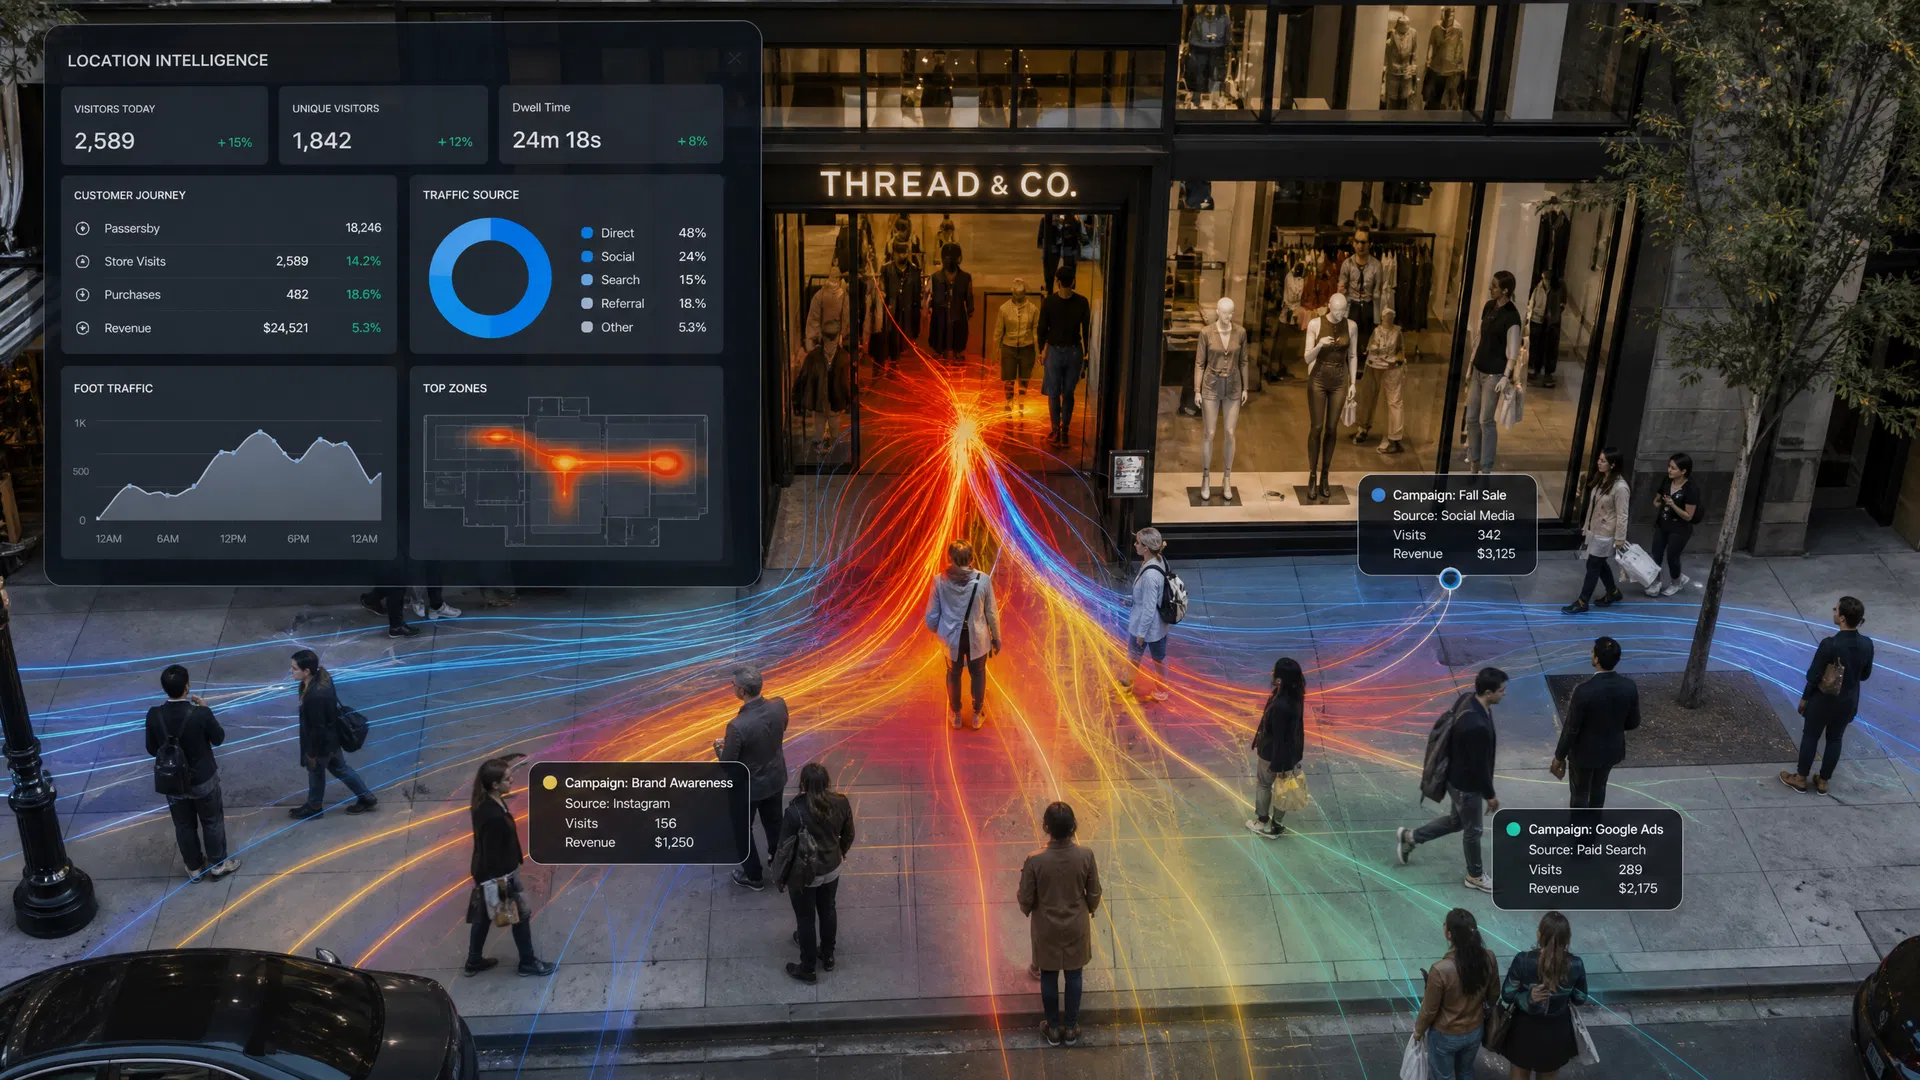
The Walk-In Rate, also known as foot traffic attribution, measures the percentage of users exposed to a geofencing ad who subsequently visit the physical store or location advertised. This metric directly links digital ad exposure to real-world store visits, providing a tangible measure of offline conversion.
- How it's Measured: This advanced metric relies on sophisticated location intelligence technology. After a user is exposed to a geofenced ad, their device's location data (with user consent) is tracked to see if they enter the advertiser's designated physical location within a specified timeframe. The number of unique store visits from exposed users is then divided by the total number of exposed users.
- Real-World Example: A retail chain launches a geofencing campaign around its various store locations, promoting a weekend sale. By tracking the walk-in rate, they can determine which ad creatives, offers, or geofenced areas are most effective at driving customers into their stores.
- Campaign Implications: The Walk-In Rate is perhaps the most powerful metric for brick-and-mortar businesses using geofencing, as it directly quantifies offline conversions. A high walk-in rate demonstrates the direct impact of your digital advertising on physical store visits, providing clear ROI. It helps optimize targeting, ad creative, and offers to maximize physical customer acquisition.
Optimizing Your Geofencing Campaigns
Understanding and tracking these four key metrics—CTR, Viewability, Impressions, and Walk-In Rate—is essential for any successful geofencing strategy. They provide a comprehensive view of your campaign's performance, from initial exposure and engagement to actual offline conversions. By continuously monitoring and optimizing based on these insights, you can refine your targeting, improve your ad creatives, and ultimately drive better results for your business.
Contact our team at Mediavision2020 for a free consultation to learn how we can help you leverage geofencing to achieve your marketing goals and measure your success with precision. Request a Quote